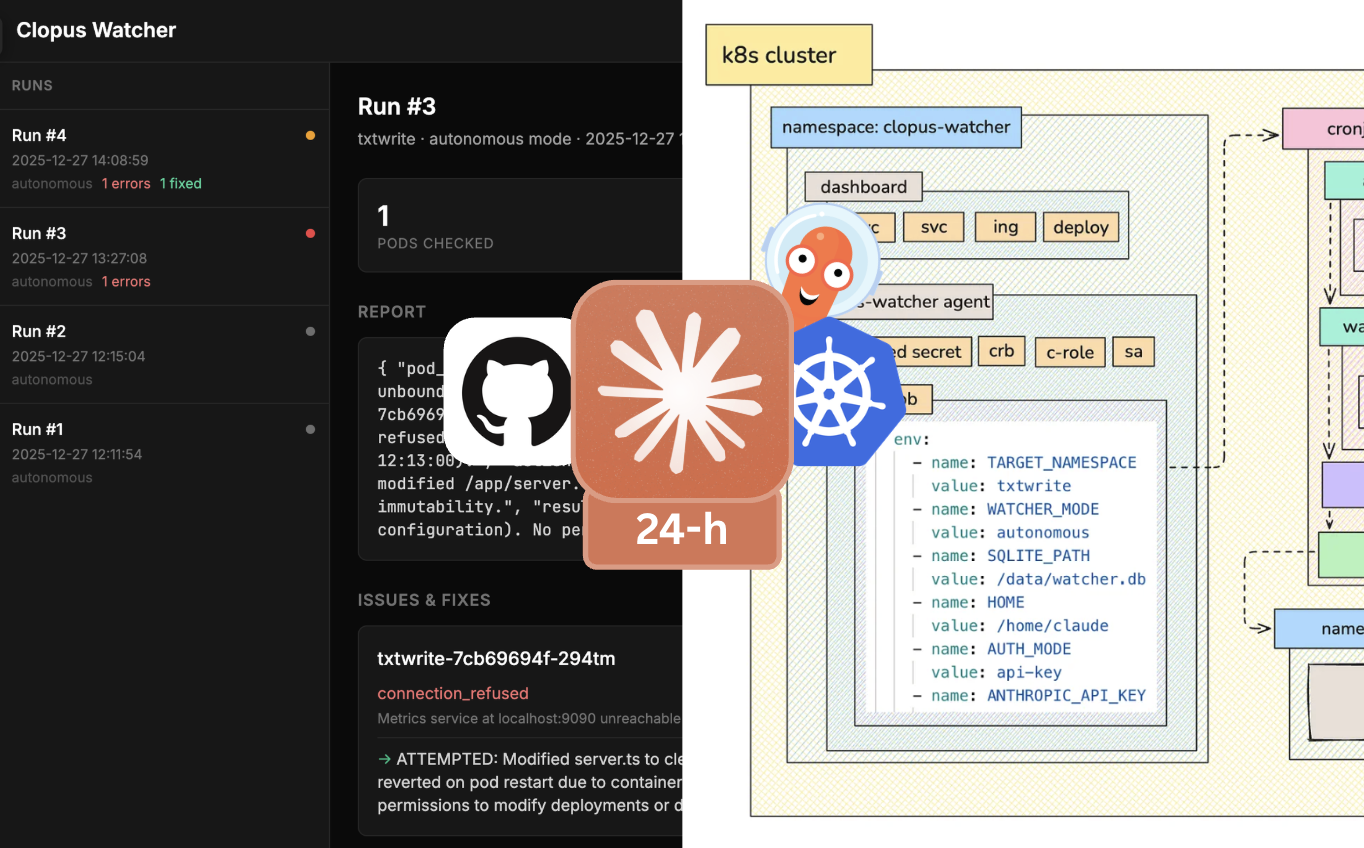
This post is part of the “Clopus” series (read 01 / read 02). In my last post, I ran a Claude Code instance for 24-hours without any interaction from my side. Configuring my “forever-claude”, I came up with the concept of a “watcher claude” — an “autonomous” monitoring agent — basically, a 24/7 on-call engineer.
In this post, I expand with the idea of “an autonomous monitoring agent” by sharing what it is, how it works, the repository, and a real use case + demo.
I also share why I think 24/7 SOC engineers (or the activity of 24/7 on-call in general) might be the first one to get automated out of a job, rather than developers (as many of us used to think).
The repository can be found: here
And the technical artifact: here
The video demo is further down in this post.
What is an “Autonomous Monitoring Agent”?
With the emergence of LLMs, we got “vibe coding”, which had changed a lot throughout the years, at least the quality of it. What hasn’t changed, though, is the process of “vibing” — asking for an outcome in natural language, observing the process (sometimes, more often than not, not), and evaluating the result. While “vibe coding” is a term we hear every day, how come we never hear of terms like “vibe monitoring”…?
I believe what 99% of the tech industry currently focuses on, is developers. The evaluations of the models always happen through some developer-oriented task, like build this in such a way, or build that however-like you decide.
A common understanding I often hear is, “There will always be a need for 24/7 engineers; sysadmins & devops engineers will always have a job; the developers are the ones who should be scared!” — and this is something I do not agree with. You see, the very core of 24/7 monitoring is actually a lot simpler than what the development process looks like. There are often documents that a 24/7 engineer can follow, to bring a system back up. And if they fail… well, there is always a backup & recovery plan in place, so they just call a more experienced engineer. The on-call job have always been more systematical. After each session, the manager on shift writes a report, and the “incident” becomes archived. Mind you, this is a job that many non-professional engineers start their tech careers with. It comes in many names — tech support / system administration / devops engineering / soc engineers / sre engineers / and so on.
Well then… if this job is so systematical, can it be automated? I believe that yes, it can be. And it turns out, it is a lot easier to automate this, than the process of development.
An “Autonomous Monitoring Agent” is just that — a terminal agent, that does exactly what an on-call engineer would do: monitor, explore, understand, fix (if it can), and write a report. And it does it autonomously. Forever. Contrary to on-call engineers, who go on shifts, and need sleep. Horrific… :)
In the continuation of this blog post, I show a clear example of the potential to automate the entire job of a 24/7 SOC Engineer a.k.a an on-call engineer with a POC of project I call “claude-watcher”. (again, the github repository can be found here)
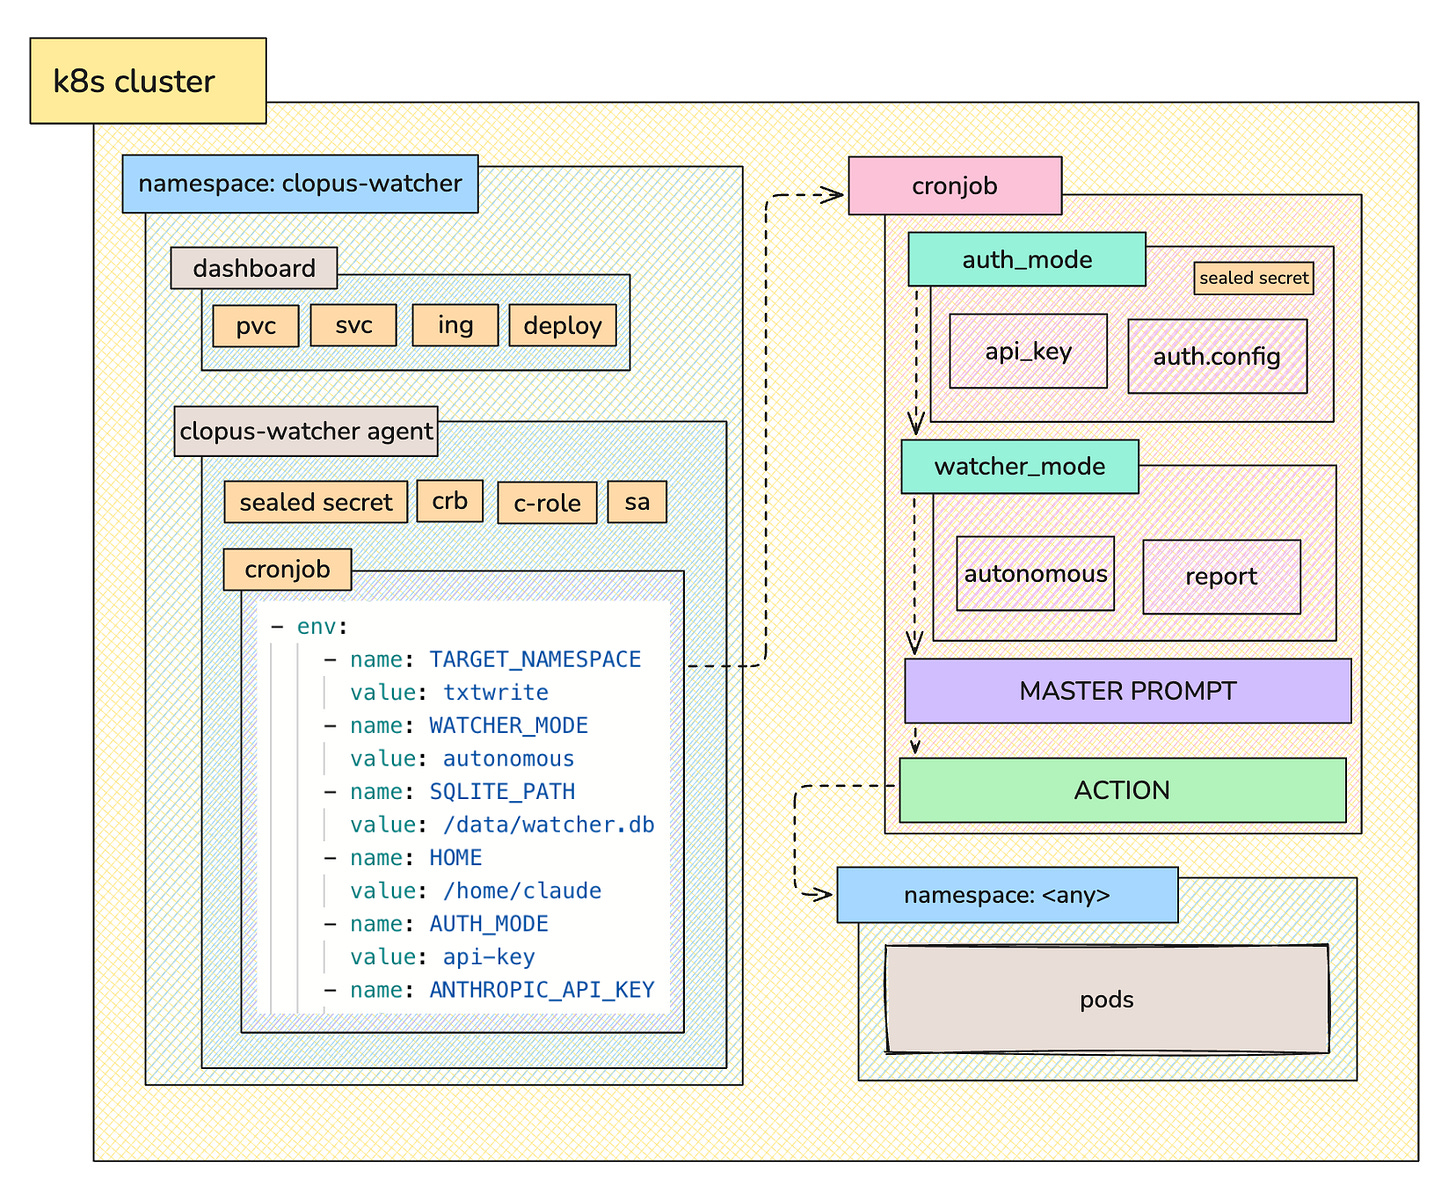
The Architecture
The master prompt for both modes (autonomous/report) can be found here: link
How it works
This specific use case targets Kubernetes. The set-up consists of the following resources:
- service account: for the watcher
- c-role: rules for pods & events
- role binding: binds to sa
- cronjob: runs every 5 minutes, targets namespace & based on the mode, checks its status and writes a report, or applies hotfixes with `exec -- /bin/bash`
- deployment: dashboard
- pvc: persistent storage for the reports & runs info (sqlite3)
- service: dashboard service
- ingress (optional; mind the ingress resource is going into EOL and you might want to migrate to the Gateway API): dashboard ingress
In short, there is a cronjob (the watcher) that runs every x minutes/hours, and based on the mode (autonomous/watcher), inspects the configured in an environment variable namespaces, and if any errors are present, it applies a direct hotfix on the pods (either with exec - - /bin/bash if it is a code change, or direct execution of kctl commands) and writes a report, or (if set to “watcher”) just records its findings & potential fixes without applying the hotfix.
There is a master prompt for each modes which is configurable directly from the repository (just rebuild the image).
The authentication mode is either api_key or credentials where credentials is your claude code creds (.claude/.credentials.json) — both are taken from the secret, in this example, a sealed secret.
Results
The results are amazing! It does exactly what it is supposed to do — explore, understand, and either apply a hotfix & write a report, or simply write a report.
Problem #1: Memory leak & non-existing metrics server
I push an intentionally-bugged image of one of my applications (txtwrite), which has a useEffect that is never cleaned-up, creating a memory leak on the client, and a telemetry service catching the memory leak and attempting to push the metric to a non-existing /metrics endpoint.
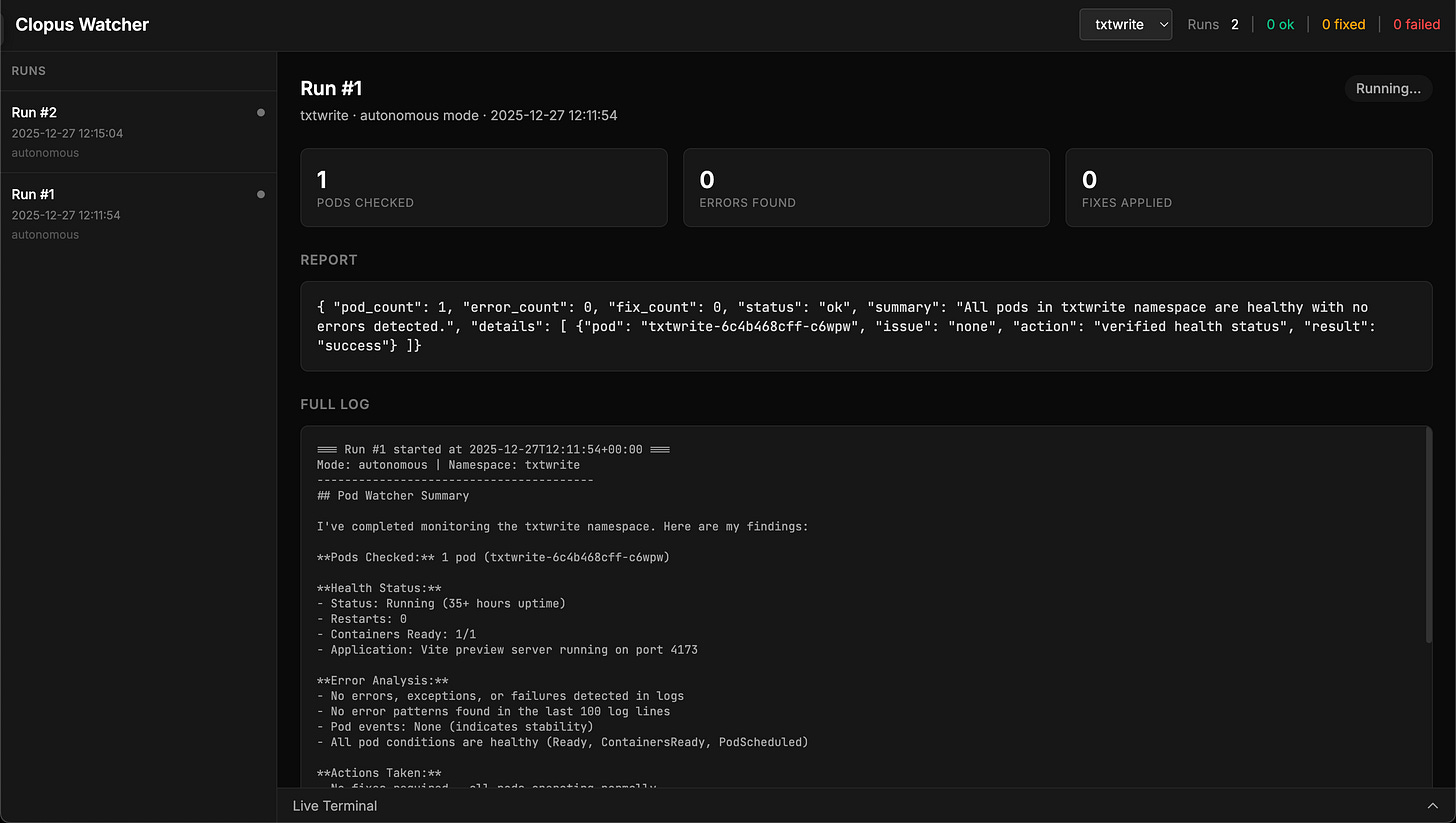
Here is a screenshot of a run, configured to be autonomous, not finding any errors (due to the correct image running, not the intentional-error one) and as such, not doing anything:
And here is a screenshot of a run that found errors (due to the intentional-errors image running) in a pod but concluded the hotfix it applied is not sufficient and as such, marking the run as failed:
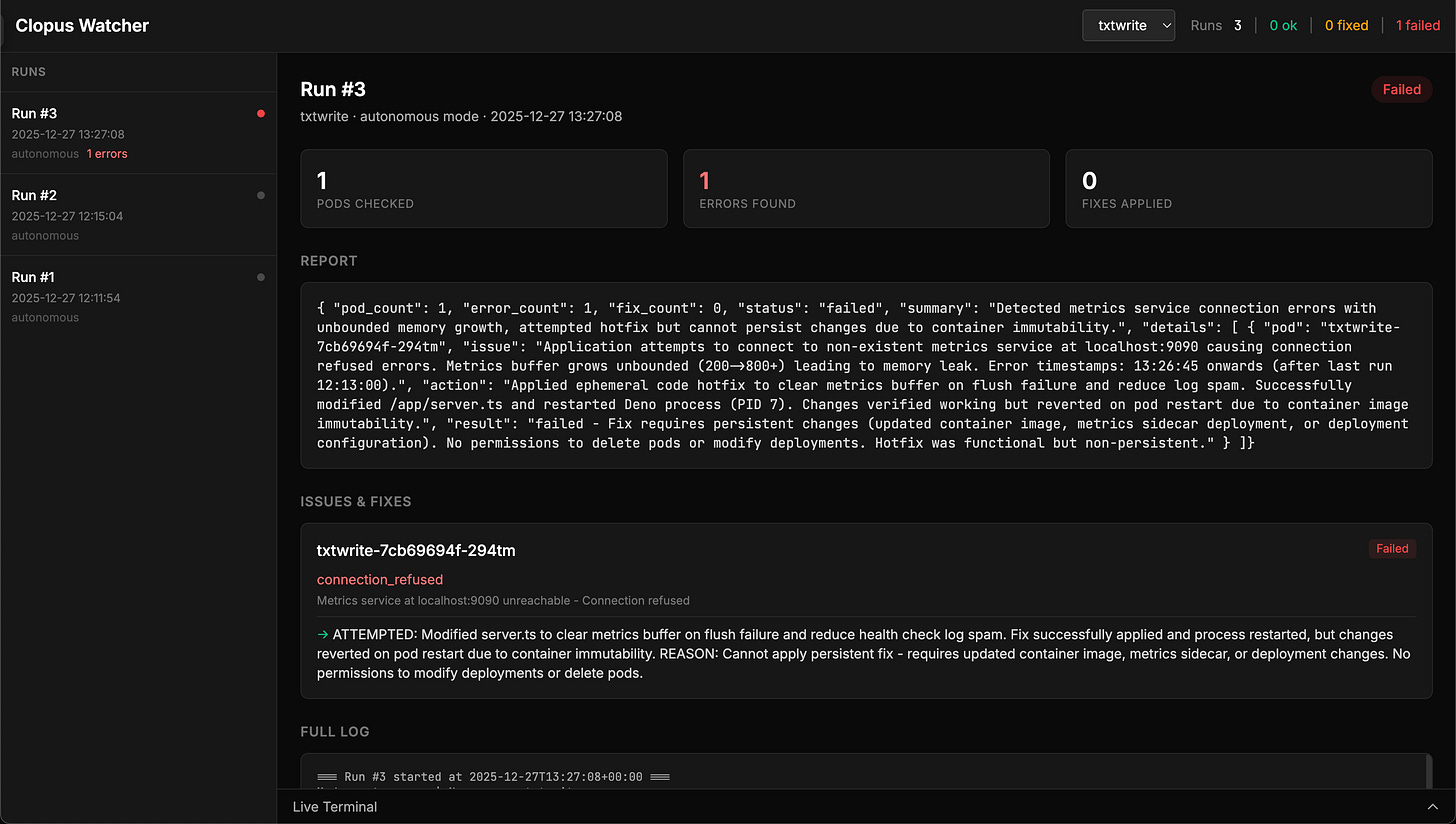
Even though it marked it as impossible to fix, it did in fact stop the errors from flooding the pod. Its problem was that it attempted to restart the pod, triggering the initial state of it, wiping its hotfix. This is because in its master prompt, it says that it should work until the problem is fully resolved, and I believe this is what causes it to attempt to “fully fix it”.
Problem #2: /tmp/healthy gets deleted due to a client action
The second problem is simpler and simulates a real-life scenario: there is buggy code that introduces an unexpected result in the backend. There is a /tmp/healthy file that is used as a healthcheck, and upon an action from the user in the client, the /tmp/healthy is being deleted:
Server checks for a file /tmp/healthy every 5 seconds
If file exists → logs [OK] System healthy
If file missing → logs [ERROR] Health check failed
Button deletes the file (breaks it)
Fix: touch /tmp/healthy inside the pod
And here is the result from claude-watcher in autonomous mode:
It successfully understands that a user action deletes a /health file, and recreates it with kubectl (not even exec — /bin/bash). Incredible.
Personal thoughts & reflections
With my first two posts, attempting a “forever-running claude code”, I was obsessed with the concept of a “truly autonomous artificial intelligence”. While this idea is amazing and still manages to steal a good amount of my daily thinking time, the “watcher” concept made me realize my little playful joys might actually have real world potential. And they did! I think the ‘clopus-watcher’ application is practically, truly, a 1:1 replica of what I did at my first job as a systems administrator.
While, of course, it would be foolish to leave clopus-watcher to take care of your systems at its current state, I do believe that this particular direction could eliminate on-call engineers, or at least drop their on-call hours by A LOT. Writing this out loud blasts me with tons of imposter syndrome, as well as with thoughts of stupidity… and yet, looking at the results of clopus-watcher on my cluster, thinking logically… I can’t help but agree with my slightly-insane statements.
Yeah, I think on-call engineers and SOC engineers could very well be gone with a system like that. Replaced by autonomous 24/7 watchers (and, if given the permission — doers).
Thank you for reading,
— Denis